

[phi double dot] + 3H[phi dot] – [nabla]2[phi] + dV/d[phi] = 0
In order to solve it, you have to make the slow roll approximation

| [phi double dot] |
is negligible compared to

| 3H[phi dot] |
and
| dV/d[phi] |
The vacuum equation of state only holds if φ changes slowly both spatially and temporally. Let’s say you have temporal and spatial scales t and x for the scalar fields. The conditions for the inflation are that the negative pressure equation of state from V(φ) must dominate the normal pressure effects of time and space derivatives.

V >> φ2/t2
V >> φ2/x2
Therefore

| dV/dφ | ~ V/φ >> φ/t2 ~ [φ double dot]
The [φ double dot] term can be neglected in the equation of motion which then takes the slow-rolling form for homogenous fields.

3H[φ dot] = -dV/dφ
The condition

V >> [φ dot]2
can now be rewritten using the show-roll relation as

ε = mpl2/16π (V’/V) << 1
Also, you can differentiate this expression to get the criterion

V’’ << V’/mpl
Ultimately, you get

η = mpl2/8π (V’’/V) << 1
The potential must be flat in the sense of having small derivatives if the field is going to roll slowly enough for inflation to be possible. If V is large enough for inflation to start in the first place, inhomogeneities rapidly become negligible. This stretching of field gradients as you increase the cosmological horizon beyond the value predicted in classical cosmology solves the monopole problem. Monopoles are point-like topological defects that arise at the GUT scale. If the horizon can be made much larger than the classical one at the end of inflation, the GUT fields then have to be aligned over a vast scale, so that topological defect formation would be extremely rare within our observable universe.
Next, I will try to illustrate the expansion and/or contraction of the universe in a variety of cosmological models, many of which have already been ruled out. You could imagine that the vertical axis is time, the horizontal axis is space, and the distance between the two vertical lines at any given time represents the volume of an arbitrary volume of space, which could be the entire universe for a closed finite universe. This is just to give a vague qualitative sense of a couple of models. The arrows on the side indicate whether time extends infinitely or not into the past or future. The small white circle is a singularity. With inflation, I just try to convey the general idea that as the universe is expanding, little pieces can suddenly expand to enormous size.
1. Steady State
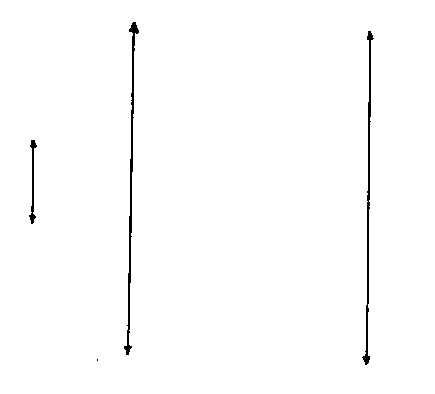
2. Big Bang, open or flat
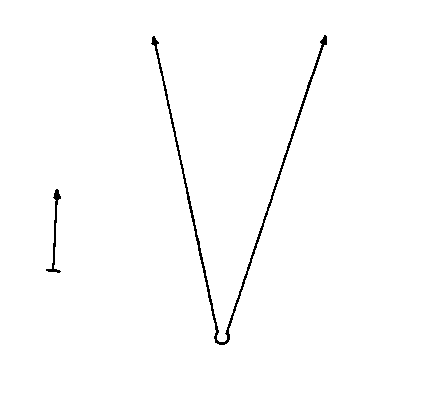
3. Big Bang, closed
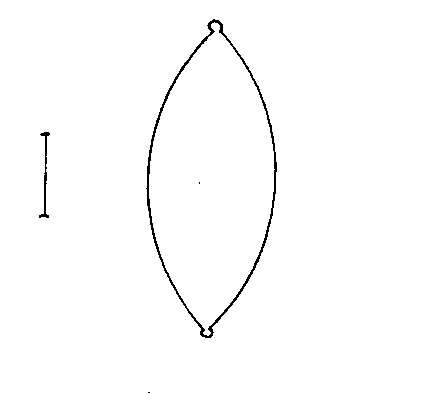
4. Inflation, with original fundamental Big Bang

5. Eternal Inflation
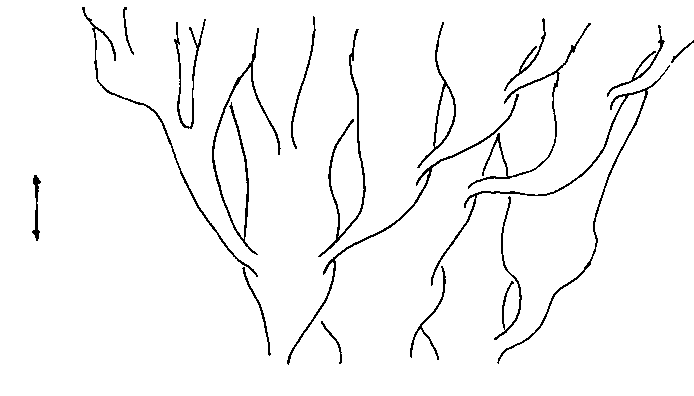
6. Ekpyrotic Universe
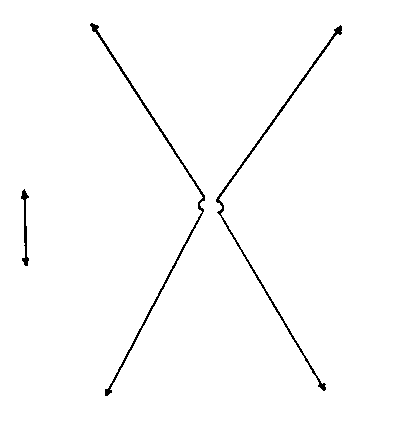
7. Cyclical Cosmology

8. Cyclical Cosmology with original fundamental Big Bang

9. Eternal Contraction with Big Crunch
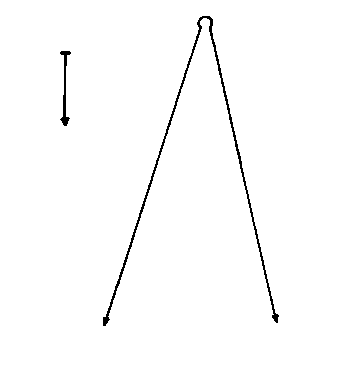
10. Bounce Cosmology
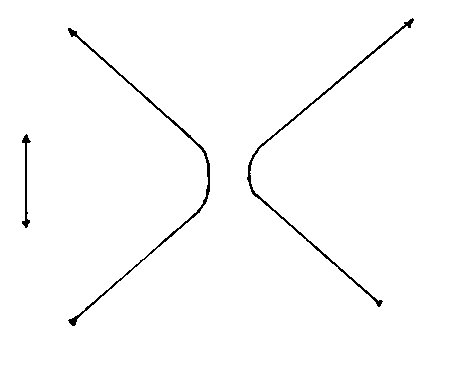
11. Loitering Cosmology
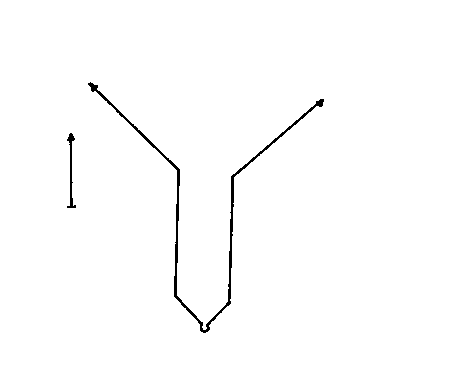
In the above list, the first one and the last three have already been ruled out. Inflation with a Big Bang is the most popular among cosmologists, and eternal inflation is the second most popular. Some prefer eternal inflation because it doesn’t have a Big Bang singularity. However, a singularity at the very beginning of the universe is not near as much a problem as a singularity in the middle of the history of the universe, which is what you have with the ekpyrotic and cyclical models. In these models, the universe existed before the singularity, and then it has to pass through a singularity afterwards. This is a serious problem for these theories at a fundamental theoretical level. In cyclical cosmology, the universe has to pass through a singularity an infinite number of times. Despite this, there are a few cosmologists who support the cyclical model. Originally inspired by Hinduism, the cyclical model was mentioned by both Carl Sagan and Star Trek.
A recent theory derived from superstring theory is brane world cosmology, which I describe at the end of my paper Beyond The Standard Model, as well as my short paper Brane World Cosmology. In this model, our universe is a D3-brane in higher dimensional space. The old cyclical model has been recast in the brane world scenario. They claim that there are two branes that attract each other, bounce off each other, or possibly pass through each other, and then attract each other again. Each collision is experienced as a Big Crunch/Big Bang on the branes. However, that’s still a form of singularity. This latest incarnation of cyclical cosmology does nothing about the problem of the universe having to pass through an infinite number of singularities.
The Universe contains luminous matter, such as stars, which makes up Ωl = 0.05. In addition, you have nonluminous baryonic matter which makes up Ωb = 0.047 ± 0.006. In addition, you have nonbaryonic dark matter, which gives you a total matter contribution of Ωm = 0.29 ± 0.07. In addition, you have vacuum energy, sometimes called dark energy, which gives a contribution of ΩΛ = 0.7, and radiation which contributes Ωr = 10-5. Now, how do we know how much all these things contribute, such as how much nonluminous baryonic matter there is, how much nonbaryonic matter there is, etc? Luminous matter, mostly stars, is the easiest to detect just by looking at the sky with a telescope that detects either visible light or other parts of the electromagnetic spectrum. This is normally done in galaxy surveys. We can calculate the amount of nonluminous baryonic matter in the Universe by looking at the Lyman alpha forests of interstellar and intergalactic hydrogen clouds. The Lyman series is the series of energies required to excite an electron in hydrogen from its lowest energy state to a higher state. A hydrogen atom with its electron in the lowest energy configuration is hit by a photon, and the electron is boosted to the second lowest energy level. The energy levels are given by En = -13.6 eV/n2. The energy difference between the lowest level, n = 1, and the second lowest level, n = 2, corresponds to a photon with a wavelength of 1216 angstroms, where one angstrom = 10-10 meters. You also have the reverse process where the electron goes from the n = 2 energy level to the ground state, and releases a photon with a wavelength of 1216 angstroms.
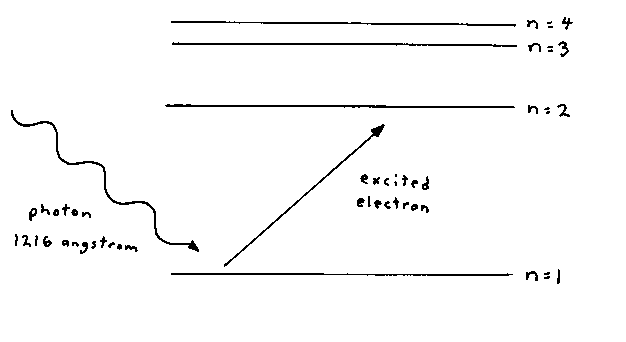
If you shine light with a wavelength of 1216 angstroms on a cloud of hydrogen atoms in their ground state, the atoms will absorb the light, and the electrons will be boosted to the next highest energy level. The more neutral hydrogen atoms in their ground state, the more light they will absorb. If you look at the light you receive, intensity as a function of wavelength, you will see a dip in the intensity at 1216 angstroms that depends on the amount of neutral hydrogen present. The amount of light absorbed, or optical depth, is proportional to the probability that the hydrogen will absorb the photon, which is the cross section, times the number of hydrogen atoms along its path. In cosmology, the hydrogen is in interstellar or intergalactic gas clouds, and the light source is quasars.
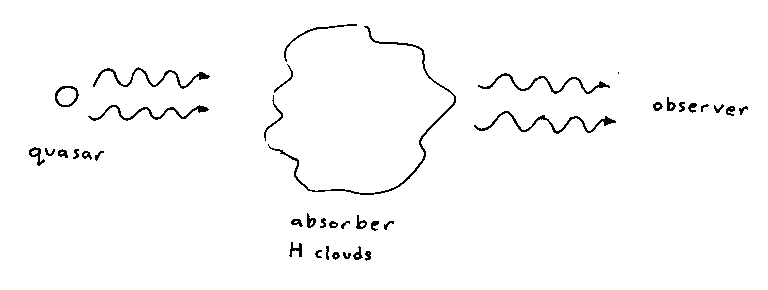
Neutral hydrogen atoms will interact with whatever light has been redshifted to a wavelength of 1216 angstroms when it reaches them. The rest of the light will keep traveling to us. From seeing how 1216 angstrom light is absorbed throughout the sky, you can calculate how much hydrogen is in the Universe.
The quasar shines with a certain spectrum or distribution of energies. Gas around the quasar both emits and absorbs photons. With the presence of neutral hydrogen, including that near the quasar, the emitted flux is depleted for certain wavelengths, indicating the absorption by this intervening neutral hydrogen. Since the 1216 angstrom wavelength is preferentially absorbed, we know that at the location at which the photon was absorbed, it probably had a wavelength of 1216 angstroms. Its wavelength was redshifted by the expansion of the Universe from what it was when it was emitted by the quasar, and if it had continued to travel to us, it would have continued to redshift beyond the 1216 angstroms it had at the absorber. Thus you see a dip in the flux at the wavelength corresponding to the 1216 angstroms the photon would have had if it had reached us. Since we can calculate how the Universe is expanding, we can tell where the photons were absorbed in relation to us. Therefore, you can use the absorption map to plot the positions of the intervening hydrogen clouds between us and the quasar.
It is common to see a series of absorption lines called the Lyman alpha forest. Systems which are more dense, called Lyman limit systems, are so thick that radiation doesn’t get into their interior. Inside these clouds, there is some neutral hydrogen remaining, screened by the outer cloud layers. If the clouds are very thick, there is instead a wide trough in the absorption. This is called a damped Lyman alpha system. Absorption lines usually aren’t at one fixed wavelength, but over a range of wavelengths, with a width and intensity determined by the lifetime of the excited n = 2 hydrogen state. These damped Lyman have enough absorption to show details of the line shape such as that determined by the excited state. Lyman alpha forest systems have 1014 atoms per centimeter. Lyman limit systems have 1017 atoms per square centimeter. Damped Lyman alpha systems have 1020 atoms per square centimeter.
Lyman alpha systems can also be used to measure the amount of deuterium in the Universe. The higher the baryon density in the early universe, the more deuterium would be converted into helium. The lower the baryon density in the early universe, the less deuterium would be converted into helium. Therefore, the more deuterium we detect today, the lower the baryon density of the universe. The less deuterium we detect today, the higher the baryon density of the universe. We detect large amounts of deuterium, which means we have a low baryon density. Also, astrophysical processes are a net destroyer of deuterium, which means that you originally had even more deuterium, which would mean an even lower baryon density. From this, we calculate the amount of baryonic matter in the Universe.
How do you determine the amount of dark matter in the Universe? As far as we know, it can only interact gravitationally, so it can only be detected through gravitational interactions. You can look at the rotation of galaxies, or look at bound systems of galaxies, and calculate how much additional mass would have to be present to keep the system bound. The main way of detecting dark matter is through gravitational lensing. According to general relativity, the presence of matter or energy density will curve spacetime, and the path of light will also be deflected. The amount it is deflected tells you the amount of intervening matter. This is called gravitational lensing. The mass that bends the light is called the lens. In fact, this is what provided proof for general relativity, during the 1919 eclipse. Usually, you don’t have to actually solve the general relativistic equations of motion for the coupled spacetime and matter, because the bending of spacetime by matter is small. The matter curving space is moving slowly relative to c, and the gravitational potential φ induced by matter obeys

| φ | /c2 << 1
Here is light from a distant source being deflected by an intervening mass.

The light can be any type of radiation. Light rays that would otherwise not reach the observer are bent from their paths and towards the observers. Light can also be bent away from the observer. Gravitational lensing is divided into three types, which are strong lensing, weak lensing, and microlensing, based on the amount of deflection. Strong lensing is the most extreme bending of light, and is when the lens is very massive, and the source is close to it. In this case, light can take different paths to the observer, and more than one image of the source will appear. The first example of a double image was that of a quasar in 1979. The number of lenses discovered can be used to estimate the volume of space back to the sources. The volume depends on cosmological parameters, especially the cosmological constant. If the brightness of the source varies with time, the multiple images will also vary with time. However, the light doesn’t travel the same distance to each image, due to the curving of space. Therefore, there will be time delays for the changes in each image. These time delays can be used to calculate Hubble’s constant. In some rare cases, the alignment of the source and the lens will be such that light will be deflected to the observer in a ring called Einstein’s ring. More often than a perfect ring, the source will form an arc. It takes a lot of mass to form an arc, so the properties of arcs, such as number, size, and shape, can be used to study very massive objects, such as clusters. Given a set of images, you can try to reconstruct the lens mass distribution.
Weak lensing is when the lens is not strong enough to create multiple images, arcs, or a ring, but instead the source is distorted by being stretched, called sheer, and/or magnified, called convergence. If all the sources are well known in size and shape, you could just use sheer and convergence to deduce the properties of the lens. However, usually you don’t know the intrinsic properties of the sources, and instead only have knowledge of average properties. The statistics of sources can then be used to get information about the lens. If there is a distribution of galaxies far enough away to serve as sources, then clusters nearby can be weighted, meaning have their masses measured, using lensing. The statistical properties of large scale structure can also be measured by weak lensing, because the matter will produce sheer and convergence in distant sources. Weak lensing is used to compliment measures of the distribution of luminous matter, such as galaxy surveys. Lensing measures all mass, both luminous matter and dark matter. Microlensing is when the lensing of an object is so small that it just makes the image appear brighter. The additional light bent towards the observer means that the source appears brighter. This can be good when you are trying to view an object that would otherwise be too dim to see. However, it’s more often a nuisance, such as when you trying to measure the distance to an object, and thus need its apparent brightness, or when you are trying to measure all objects brighter than a certain amount in a certain region, and microlensing brings additional objects into the sample you don’t want. Gravitational lensing measures all mass, including dark matter, and thus is our main away of measuring the amount of nonbaryonic matter in the Universe.
It was always assumed that there was some nonluminious matter in the Universe. For instance, planets would count as nonluminous. However, the mass of all the planets in the Solar System put together is less than one percent the mass of the Sun. Therefore, it was assumed that nonluminous matter was negligible. Then in the 1930’s, Zwicky and Smith both examined two nearby clusters of galaxies, the Virgo Cluster and the Coma Cluster. They studied the galaxies making up the clusters, and their velocities, and determined that the velocities of the galaxies was 10 – 100 times too large. The velocities indicate the total mass in two ways. First of all, the more mass in the cluster, the greater the gravitational forces acting on each galaxy, which accelerates the galaxies to higher velocities. Second of all, if the velocity of a given galaxy is too large, the galaxy will be able to break free of the gravitational pull of the cluster. If the galaxy’s velocity is larger than the escape velocity, the galaxy will leave the cluster. By assuming that all galaxies in a cluster have velocities less than the escape velocity, you can estimate the total mass. This was the first suggestion of significant amounts of nonluminous matter in the Universe. However, it was inconclusive. Even though the velocities are large, the clusters of galaxies are so stupendously large, that the galaxies appear to move in slow motion. So, it’s as if we only get to see one frame of a movie. Maybe a galaxy with high velocity really is leaving the cluster. Maybe it was never part of the cluster in the first place, and was just passing through. Maybe some of the galaxies that you are including in the cluster are just foreground galaxies in the line of sight.
In the 1970’s, Rubin, Freeman, Peebles, and others started measuring the rotation curves of galaxies. According to Kepler’s Laws, an orbiting body should move slower the farther it is from the axis of rotation, which is the center mass it’s orbiting. For instance, in the Solar System, Pluto moves much slower than Mercury. However, this is not what they found for galaxies. With spiral galaxies, the velocities of the stars did not decrease as you got farther from the center of the galaxy. The Milky Way rotates once every ¼ billion years, so they could only detect the velocities by the Doppler effect. As you look at spiral galaxies, the velocities of the stars remain high all the way out to the edge. This strongly suggests that what you think is the edge of the galaxy is only the edge of the luminous matter in the galaxy, and the rest of the galaxy, which is dark matter, extends for a much greater distance away from the center of the galaxy. By finding the rotation velocities along a galaxy, you can weigh the mass of the galaxy inside the orbit. This was the first strong evidence for dark matter. Later, you had evidence from gravitational lensing. Also, inflationary cosmology predicted the universe was flat, and the amount of luminous matter was not enough to flatten the universe. We now know that even the dark matter is not enough to flatten the universe, and you need dark energy.
Today, our view of the Universe according to cosmology is totally consistent within itself, and with observation, such as the recent WMAP data, other CMB data, and the supernovae Ia data. However, one very obvious gap in our knowledge is that even though we can talk about dark matter, and include it in our equations, we don’t know what it actually is. This is probably the most obvious unanswered question in physics today. Now at first it was hoped that dark matter could be something normal such as planets, Jupiters, brown dwarves, or white dwarves. Planets could only contribute a maximum of Ω = 0.005. Jupiters are Jupiter-like planets. Brown dwarves are failed stars not large enough to ignite, larger than Jupiter but smaller than the Sun. White dwarves are the final stage of stars like the Sun. However, all of these things are made of baryons. We can measure the amount of baryonic matter in the Universe, and it’s much less than what we measure the dark matter to be. That means dark matter must be nonbaryonic matter.
Here, I list the primary candidates for nonbaryonic dark matter. They are listed in order of how likely they are, or how mainstream the theory is. Since these are mostly derived from particle physics, you should read my papers The Standard Model, and Beyond The Standard Model for more information.
1. Neutrinos – These are Standard Model leptons. Since neutrino oscillation has proved that neutrinos have mass, they were an obvious candidate for dark matter. However, it was determined that the neutrino masses are so small that they can only account for a small percentage of the dark matter. Today, we assume that a small percentage of the dark matter is due to neutrinos, and we’re trying to explain the rest of it.
2. Supersymmetric Particles – We invented supersymmetry to explain the hierarchy problem, and the theory doubles the number of particles. According to the minimal supersymmetric standard model, the lightest supersymmetric particle, or LSP, should be stable, and could account for dark mater. It’s usually called a neutalino. These are considered weakly interacting massive particles, or WIMP’s.
3. Axions – These are Goldstone bosons formed by Peccei-Quinn symmetry breaking.
4. Primordial Back Holes – According to some theories, large numbers of tiny black holes could be left over from the Big Bang.
5. Cosmic Strings – This is a one dimensional topological defect.
6. Strangelets – Some theories claim you can have stable particles containing strange quarks.
7. Quark Nuggets – Some theories claim you could have macroscopic amounts of quark matter.
8. Fermi Balls – Symmetry breaking creates domains in the early universe. These bubbles of false vacuum would shrink down but might stop at a non-zero size if they contain fermions. Fermi balls are non-topological solitons.
9. Q-balls – This is another type of non-topological soliton.
10. Mirror Fermions – Some theories designed to explain why the Standard Model is chiral predict mirror fermions.
11. Chaplygin Gas - This is an entity with an exotic equation of state that could explain both dark matter and dark energy.
12. Quartessence – A version of quintessence that claims to explain not only the dark energy but the dark matter also.
There are tons of other suggestions that I won’t bother to mention. Physicists certainly don’t lack imagination when it comes to thinking up new candidates for dark matter. The proliferation of suggestions indicates the lack of evidence for what it actually is.
There used to be an alternative to dark matter as an explanation for galactic rotations called MOND. It was observed that the star velocities do not decrease as you go out to the edge of the galaxy, as they should according to Newtonian mechanics. The common explanation was that there is matter in the galaxy that extends far beyond what we can see. An alternative explanation is that Newtonian mechanics has to be modified at large distances. This is called Modified Newtonian Mechanics, or MOND, and was invented by Milgrom in 1983. It involves just adding terms to the equations to make the predictions fit the rotation curves of galaxies. The fact it fits is not surprising since it was designed to do just that. The main problem with MOND at the theoretical level was that it was totally ad hoc and not motivated by underlying physics. As time went on, there was more and more observational evidence for dark matter until the evidence was overwhelming. Dark matter basically won that debate. In physics, you try to choose the simplest explanation. Most people felt the simplest explanation was dark matter, and MOND was too radical. The few supporters of MOND sincerely believed that MOND was the simpler explanation, and that dark matter was too radical.
The existence of the cosmic microwave background radiation was first predicted by George Gamow in 1948, and by Ralph Alpher and Robert Herman in 1949. It was first detected by Arno Penzias and Robert Wilson in 1964 at the Bell Telephone Laboratories in Murray Hill, New Jersey. They had no clue what it was. They thought it was just a source of excess noise in the microwave radio receiver they were building. They went so far as to clean the pigeon shit out of the microwave antenna to try to get rid of it. Coincidentally, at that same time, researchers led by Robert Dicke at the nearby Princeton University were devising an experiment to try to detect the cosmic microwave background. When they first heard about the problems Penzias and Wilson were having with the background static, they instantly recognized what it was. They were enthusiastic that the cosmic microwave background had been found. There was then a pair of papers in Physical Review. One was by Penzias and Wilson describing their observations. The other was by Dicke, Peebles, and Wilkinson declaring that this was in fact the long sought cosmic microwave background. Later, Penzias and Wilson received the 1979 Nobel prize in physics.
Since then, there have been numerous experiments designed to study the cosmic microwave background, which is isotropic to one part in 105, but does have anisotropies which reveal a great deal about the Universe. Most recent experiments were intended to probe the anisotropies in the CMB. It turns out that the temperature fluctuations in the CMB are a very close match to what is theoretically predicted by inflationary cosmology. The COBE satellite was launched in 1989, and carried three instruments. The Diffuse Infrared Background Experiment searched for cosmic infrafred background radiation. The Differential Microwave Radiometer measured the cosmic microwave radiation. The Far Infrared Absolute Spectraphotometer compared the spectrum of the cosmic microwave background radiation with a perfect blackbody. BOOMERANG was a balloon based experiment that floated around Antarctica for ten days in 1998. The name was a pun since they released it, it went around in a circle, and then it came back to where they released it. Here, I’ll list the major experiments. Satellite CMB experiments include WMAP, COBE, Planck, and DIMES. Balloon-based experiments include BOOMERANG, MAXIMA, FIRS, ARGO, MAX, QMAP, and many others. Ground-based experiments include DASI, COBRA, VSA, CBI, IAC, White, Dish, CAT, OVRO, ACBAR, and many others. One of the people on Robert Dicke’s team in 1964 was Dave Wilkinson who later spearheaded a project to create a probe called the Microwave Anisotropy Probe, or MAP. When Wilkinson died, it was renamed the Wilkinson Anisotropy Probe, or WMAP. In June 2001, a Delta rocket launched NASA’s 840 kg Microwave Anisotropy Probe on a journey that took it to the L2 Lagrange point, 1.5 million km antisunward from Earth. Then the probe began continuously mapping with unprecedented precision, the very small departures from the almost perfect isotropy of the cosmic background radiation, and the even fainter polarization caused by these anisotropies. The WMAP probe has given us far better cosmological data than we’ve ever had before.
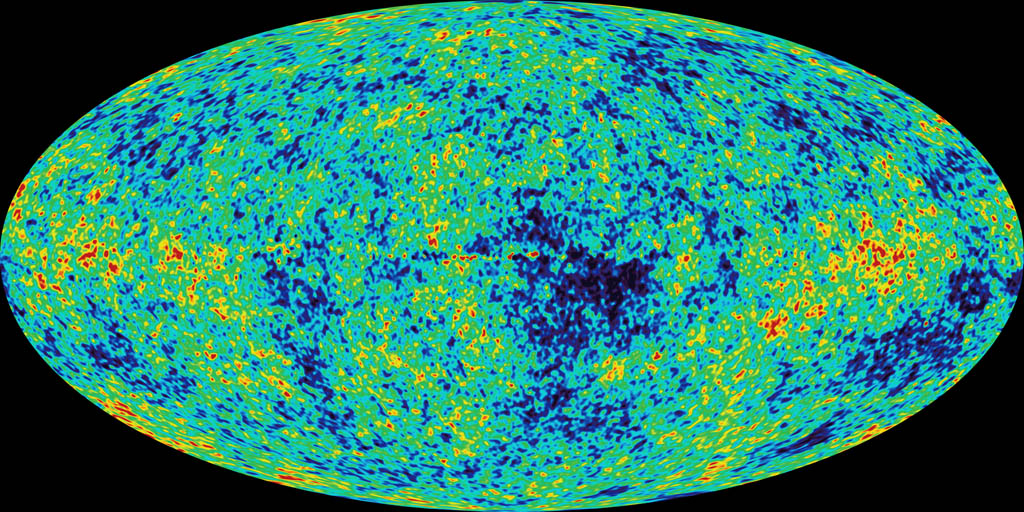
Some people hailed WMAP as the beginning of precision cosmology. Of course, people said the same thing about Galileo’s work. WMAP’s design was optimized to improve the calibration uncertainties of previous CMB probes by an order of magnitude. With its sensitivity and uninterrupted full sky coverage at five different microwave frequencies. WMAP measured the first acoustic peak in the CMB temperature anisotropy power spectrum with error bars smaller than the cosmic variance that randomizes the power spectrum seen by an observer at any given location in the Universe. The microkelvin hot and cold regions in the all sky map of the CMB from WMAP indicate local regions at the end of the plasma epoch that had mass densities very slightly higher or lower than the mean. The expansion and contraction of such density fluctuations are acoustic wave phenomena in the viscous elastic plasma fluid in which radiation pressure completes with gravitational contraction. The sound speed that limits how fast a hot or cold spot could have expanded in the plasma is about C/[squareroot of 3]. To compare the CMB observations with theory and extract the best-fit cosmological parameters, it is useful to obtain the angular power spectrum of temperature fluctuations by decomposing the celestial map of departures ΔT from the mean CMB temperature into a sum of spherical harmonics

Yl, m(θ, φ)
Where l is lower case “L”, and is the multipole moment, and m is the azimuthal index.
Temperature fluctuations on the microwave sky can be expressed as a sum of spherical harmonics, similar to how music can be expressed as a sum of ordinary harmonics. A musical note is the sum of the fundamental, second harmonic, third harmonic, etc. The relative strengths of the harmonics determine the tone quality, which distinguishes a middle C played on a flute and a clarinet. The temperature map of the microwave sky is the sum of the spherical harmonics, or the power spectrum, and indicate the geometry of the Universe.
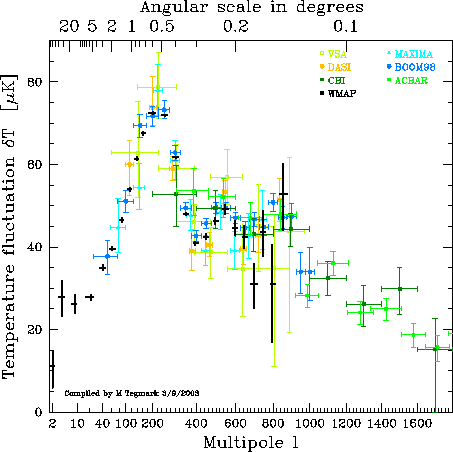
The fluctuation power at multipole l is then given by the mean square value of the expansion coefficients al, m averaged over the 2l + 1 values of the azimuthal index m. Since there is no preferred direction on the CMB sky, the distribution of power m varies randomly with the observer’s position in the Universe. Therefore, the cosmic variance is widest at small l. The only slight discrepancy in the WMAP data with the theoretical prediction is the slightly low quadrupole. The temperature fluctuation power for a given l measures the mean square temperature difference between points on the sky separated by an angle of order π/l. The harmonic sequence of distinct acoustic peaks is attributed to the abrupt beginning and end of the plasma epoch. The end catches different oscillation modes that happen to be maximally overdense or underdense at the instant CMB photons were set free. The positions and heights of the peaks constrain cosmological parameters. The l range of a CMB telescope is limited by its angular resolution. WMAP has an angular resolution of about 12 arcminutes so it can’t follow the power spectrum beyond l = 800. CBI and ACBAR are two ground-based microwave telescopes with finer angular resolution than WMAP. Here is the data from many different CMB experiments, plotting multipole versus temperature fluctuation.
WMAP greatly increased of knowledge of several cosmological parameters, some of which are listed below.
Baryon Density

Ωbh2 = 0.024 ± 0.001
Matter Density

Ωmh2 = 0.14 ± 0.02
Hubble’s Constant

h = 0.72 ± 0.05
Amplitude

A = 0.9 ± 0.1
Optical Depth

τ = 0.166- 0.071+ 0.076
Spectral Index

ns = 0.99 ± 0.04
Amplitude of Galaxy Fluctuations

σ8 = 0.9 ± 0.1
Characteristic Amplitude of Velocity Fluctuations

σ8Ωm0.6 = 0.44 ± 0.10
Baryon Density/Critical Density

Ωb = 0.047 ± 0.006
Matter Density/Critical Density

Ωm = 0.29 ± 0.07
Age of the Universe

t0 = 13.4 ± 0.3 Gyr
Redshift at Reionization

zr = 17 ± 5
Redshift at Decoupling

zdec = 1088- 2+ 1
Age of the Universe at Decoupling

tdec = 372 ± 14 kyr
Thickness of Surface at Last Scatter

Δzdec = 194 ± 2
Duration of Last Scatter

Δtdec = 115 ± 5 kyr
Redshift at Matter/Radiation Equality

zeq = 3454- 392+ 385
Sound Horizon at Decoupling

rs = 144 ± 4 Mpc
Angular Diameter Distance to the Decoupling Surface

dA = 13.7 ± 0.5 Cpc
Acoustic Angular Scale

lA = 299 ± 2
Current Density of Baryons

nb = (2.7 ± 0.1) x 10-7 cm-3
Baryon/Photon Ratio

η = (6.5 - 0.3+ 0.4) x 10-10